Archive:Debug python scripts with WinPDB: Difference between revisions
Jump to navigation
Jump to search
>Anarchintosh (→Start debugging session: removed how to start Winpdb, to put it in a different section) |
>Anarchintosh (added How to Start WinPDB section) |
||
| Line 32: | Line 32: | ||
rpdb2.start_embedded_debugger('pw') | rpdb2.start_embedded_debugger('pw') | ||
</pre> | </pre> | ||
==How to start WinPDB== | |||
* Linux: (Desktop Menu Bar -> Applications -> Programming -> Winpdb) | |||
* Windows/Mac: Execute winpdb.py. For a quicker launch, make shortcut on desktop for (example location:) | |||
<pre> | |||
C:\Python27\Scripts\winpdb.py | |||
</pre> | |||
==Start debugging session== | ==Start debugging session== | ||
* From within XBMC, start your script (it will appear to sit there and hang) | * From within XBMC, start your script (it will appear to sit there and hang) | ||
* Start WinPDB | |||
* In WinPDB, select File->Password and enter "pw" (no quotes) | * In WinPDB, select File->Password and enter "pw" (no quotes) | ||
* Select File->Attach. You should see your running script in the list box along with its PID and filename. | * Select File->Attach. You should see your running script in the list box along with its PID and filename. | ||
Revision as of 13:47, 3 November 2010
You can easily debug python scripts running inside XBMC in a few simple steps!
Requirements
- XBMC installed on Linux or Windows (should also work fine on Mac)
- Install WinPDB. Download the binary installer for Windows or Mac, use this command for Linux:
$ sudo apt-get install winpdb
- On Mac, Windows and some Linux distros you will also need to install wxPython. Always use the 32-bit version.
Create a symlink for the debugger
How to make a symlink in Linux
- Assuming your script's name is Foo
$ cd /home/<user>/.xbmc/scripts/Foo
$ ln -s `find /usr/lib/pymodules -name rpdb2.py`
How to make a symlink in Windows
- Get and open the program Directory Linker
- For Link Location: point to your addon folder in XBMC, and then add winpdb.py on the end of the path. For example:
C:\Program Files (x86)\XBMC\addons\plugin.video.icefilms\winpdb.py
- For Link To: point to where the original winpdp.py file can be found. (Should be with your other Python modules) For example:
C:\Python27\Scripts\winpdb.py
- Click Go! button
Modify your script to enable debugger
- Edit /home/<user>/.xbmc/scripts/Foo/default.py and add the following code to the top
import rpdb2
rpdb2.start_embedded_debugger('pw')
How to start WinPDB
- Linux: (Desktop Menu Bar -> Applications -> Programming -> Winpdb)
- Windows/Mac: Execute winpdb.py. For a quicker launch, make shortcut on desktop for (example location:)
C:\Python27\Scripts\winpdb.py
Start debugging session
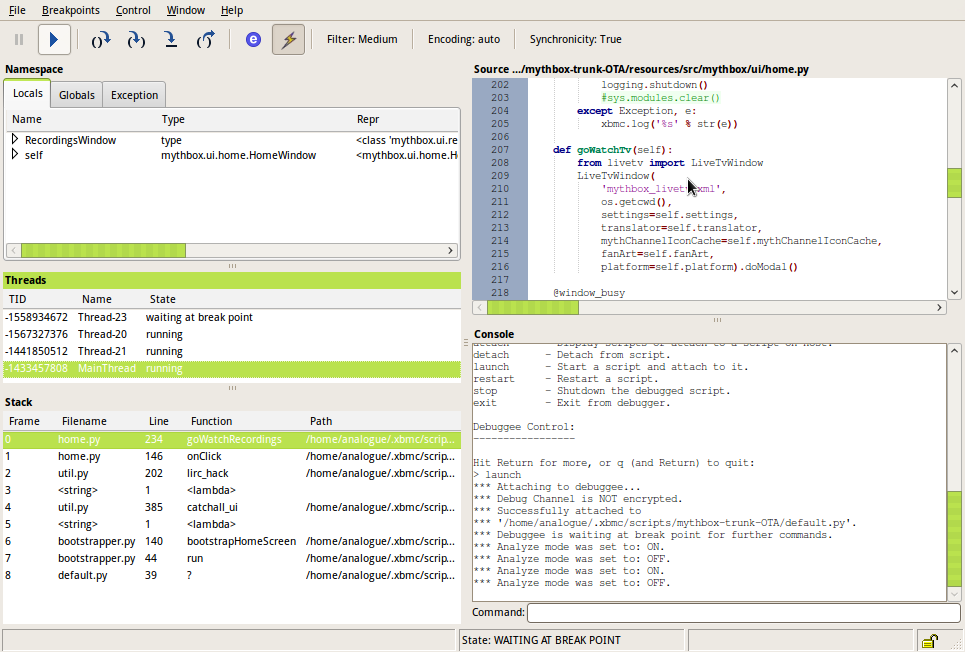
- From within XBMC, start your script (it will appear to sit there and hang)
- Start WinPDB
- In WinPDB, select File->Password and enter "pw" (no quotes)
- Select File->Attach. You should see your running script in the list box along with its PID and filename.
- Select your script and click OK. The debugger is now attached to your script.
Setting breakpoints
TBD
