Archive:Debug python scripts with WinPDB: Difference between revisions
Jump to navigation
Jump to search
>Anarchintosh (→Create a symlink for the debugger: added entry for making symlink in Windows) |
mNo edit summary |
||
| (23 intermediate revisions by 8 users not shown) | |||
| Line 1: | Line 1: | ||
You can easily debug python scripts running inside XBMC in a few simple steps using WinPDB! | |||
==Create a symlink for the debugger== | == Requirements == | ||
'''How to make a symlink | * XBMC installed on Linux or Windows (should also work fine on Mac) | ||
* Install [http://winpdb.org/ WinPDB]. Download the binary installer for Windows or Mac, use this command for Linux: <pre>$ sudo apt-get install winpdb</pre> | |||
* On Mac, Windows and some Linux distros you will also need to install [http://www.wxpython.org/download.php#binaries wxPython]. If you are using 32-bit python, use the 32-bit version. Always get the unicode version | |||
== Create a symlink for the debugger == | |||
'''How to make a symlink in Linux''' | |||
* Assuming your script's name is Foo | * Assuming your script's name is Foo | ||
<pre> | <pre> | ||
| Line 13: | Line 15: | ||
</pre> | </pre> | ||
'''How to make a symlink | '''How to make a symlink in Windows''' | ||
* | * At Command Prompt type the equivalent of this, with your own paths: | ||
''For Windows 7'' | |||
<pre> | <pre> | ||
C:\Program Files (x86)\XBMC\addons\plugin.video.icefilms\ | mklink "C:\Program Files (x86)\XBMC\addons\plugin.video.icefilms\rpdb2.py" "C:\Python27\Scripts\rpdb2.py" | ||
</pre> | </pre> | ||
''For Windows XP, Vista'' | |||
<pre> | <pre> | ||
C:\Python27\Scripts\ | fsutil hardlink "C:\Program Files (x86)\XBMC\addons\plugin.video.icefilms\rpdb2.py" "C:\Python27\Scripts\rpdb2.py" | ||
</pre> | </pre> | ||
The first path makes the link in your addon folder, the second path tells the link to point to where the original rpdb2.py file can be found. | |||
==Modify your script to enable debugger== | == Modify your script to enable debugger == | ||
* Edit /home/<user>/.xbmc/scripts/Foo/default.py and add the following code to the top | * Edit /home/<user>/.xbmc/scripts/Foo/default.py and add the following code to the top | ||
<pre> | <pre> | ||
| Line 31: | Line 33: | ||
rpdb2.start_embedded_debugger('pw') | rpdb2.start_embedded_debugger('pw') | ||
</pre> | </pre> | ||
==Start debugging session== | == How to start WinPDB == | ||
* Linux: (Desktop Menu Bar -> Applications -> Programming -> Winpdb) | |||
* Windows/Mac: Execute winpdb.py. For a quicker launch, make shortcut on desktop for (example location:) | |||
<pre> | |||
C:\Python27\Scripts\winpdb.py | |||
</pre> | |||
== Start debugging session == | |||
* From within XBMC, start your script (it will appear to sit there and hang) | * From within XBMC, start your script (it will appear to sit there and hang) | ||
* Start | * Start WinPDB | ||
* In WinPDB, select File->Password and enter "pw" (no quotes) | * In WinPDB, select File->Password and enter "pw" (no quotes) | ||
* Select File->Attach. You should see your running script in the list box along with its PID and filename. | * Select File->Attach. You should see your running script in the list box along with its PID and filename. | ||
* Select your script and click OK. The debugger is now attached to your script. | * Select your script and click OK. The debugger is now attached to your script. | ||
==Setting breakpoints== | == Setting breakpoints == | ||
TBD | TBD | ||
==Screenshot== | == Screenshot == | ||
[[File:winpdb-session.png]] | [[File:winpdb-session.png]] | ||
[[Category:Development-Archived]] | |||
Latest revision as of 04:49, 21 July 2020
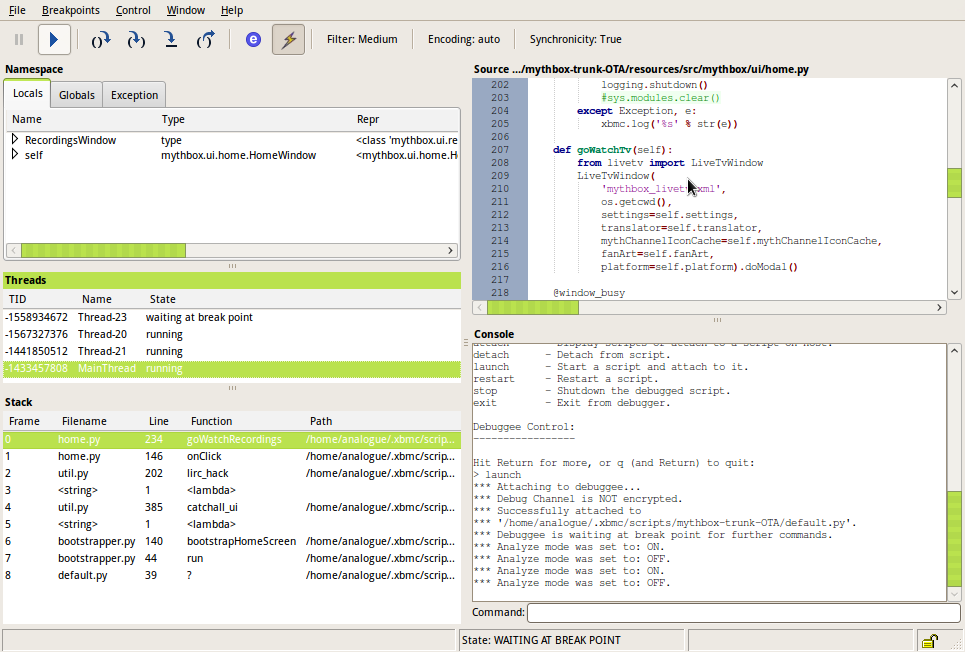
You can easily debug python scripts running inside XBMC in a few simple steps using WinPDB!
Requirements
- XBMC installed on Linux or Windows (should also work fine on Mac)
- Install WinPDB. Download the binary installer for Windows or Mac, use this command for Linux:
$ sudo apt-get install winpdb
- On Mac, Windows and some Linux distros you will also need to install wxPython. If you are using 32-bit python, use the 32-bit version. Always get the unicode version
Create a symlink for the debugger
How to make a symlink in Linux
- Assuming your script's name is Foo
$ cd /home/<user>/.xbmc/scripts/Foo
$ ln -s `find /usr/lib/pymodules -name rpdb2.py`
How to make a symlink in Windows
- At Command Prompt type the equivalent of this, with your own paths:
For Windows 7
mklink "C:\Program Files (x86)\XBMC\addons\plugin.video.icefilms\rpdb2.py" "C:\Python27\Scripts\rpdb2.py"
For Windows XP, Vista
fsutil hardlink "C:\Program Files (x86)\XBMC\addons\plugin.video.icefilms\rpdb2.py" "C:\Python27\Scripts\rpdb2.py"
The first path makes the link in your addon folder, the second path tells the link to point to where the original rpdb2.py file can be found.
Modify your script to enable debugger
- Edit /home/<user>/.xbmc/scripts/Foo/default.py and add the following code to the top
import rpdb2
rpdb2.start_embedded_debugger('pw')
How to start WinPDB
- Linux: (Desktop Menu Bar -> Applications -> Programming -> Winpdb)
- Windows/Mac: Execute winpdb.py. For a quicker launch, make shortcut on desktop for (example location:)
C:\Python27\Scripts\winpdb.py
Start debugging session
- From within XBMC, start your script (it will appear to sit there and hang)
- Start WinPDB
- In WinPDB, select File->Password and enter "pw" (no quotes)
- Select File->Attach. You should see your running script in the list box along with its PID and filename.
- Select your script and click OK. The debugger is now attached to your script.
Setting breakpoints
TBD
