Debugging via Renderdoc: Difference between revisions
m (add categories) |
|||
| Line 8: | Line 8: | ||
== Capturing a frame == | == Capturing a frame == | ||
Firstly, it is highly recommended to disable [[Advancedsettings.xml#smartredraw|smart redraw]] and [[Advancedsettings.xml#algorithmdirtyregions|dirty regions]] in Kodi. | |||
Install and run Renderdoc. Go to the "Launch Application" tab, select the Kodi executable and click "Launch" | Install and run Renderdoc. Go to the "Launch Application" tab, select the Kodi executable and click "Launch" | ||
Latest revision as of 07:30, 8 June 2022
What's Renderdoc?
Renderdoc (https://renderdoc.org/) is a free graphics debugger for OpenGL and DirectX. It can record, store and replay frames rendered by an application. It exposes a plethora of information related to the commands the GPU receives.
The scope of this tutorial is to give you an idea how it can be used to debug Kodi skins.
Capturing a frame
Firstly, it is highly recommended to disable smart redraw and dirty regions in Kodi.
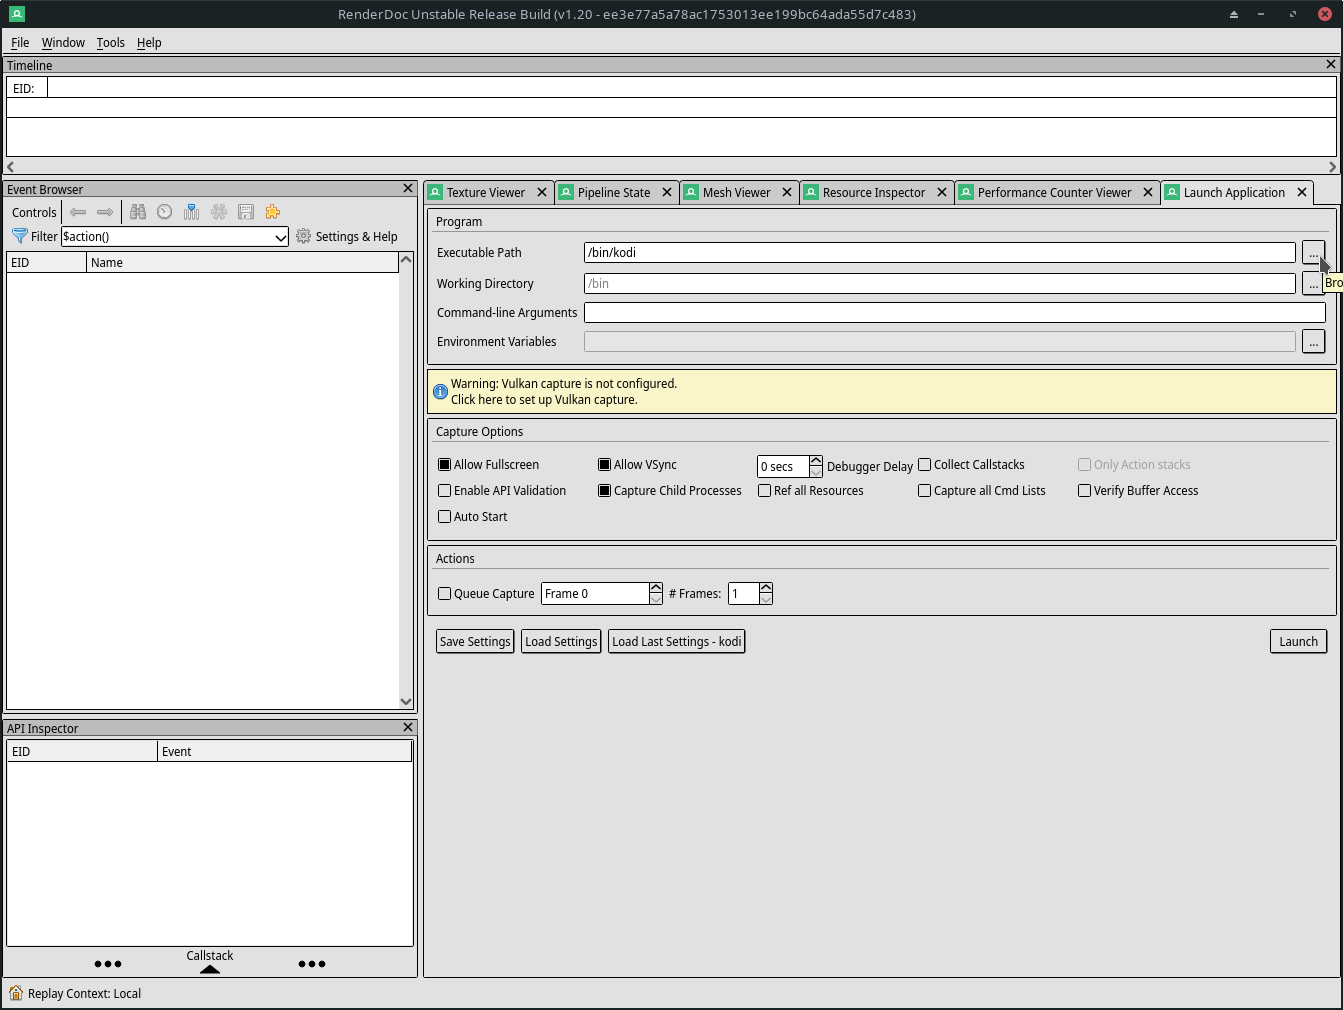
Install and run Renderdoc. Go to the "Launch Application" tab, select the Kodi executable and click "Launch"
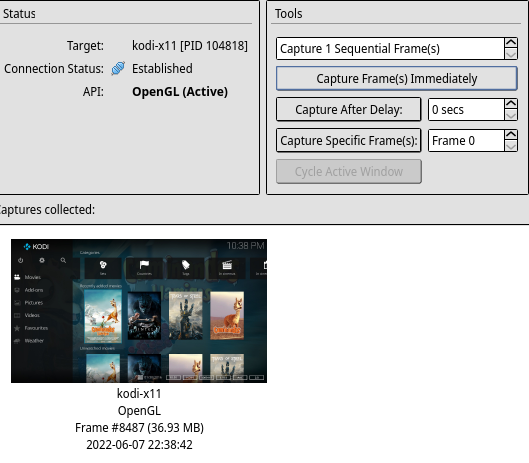
Kodi should start up. Navigate to a view you want to analyze. In Renderdoc, select "Capture Frame(s) Immediately". The capture should show up. Activate it via double click.
You can save this capture for future reference.
Analyzing frame composition
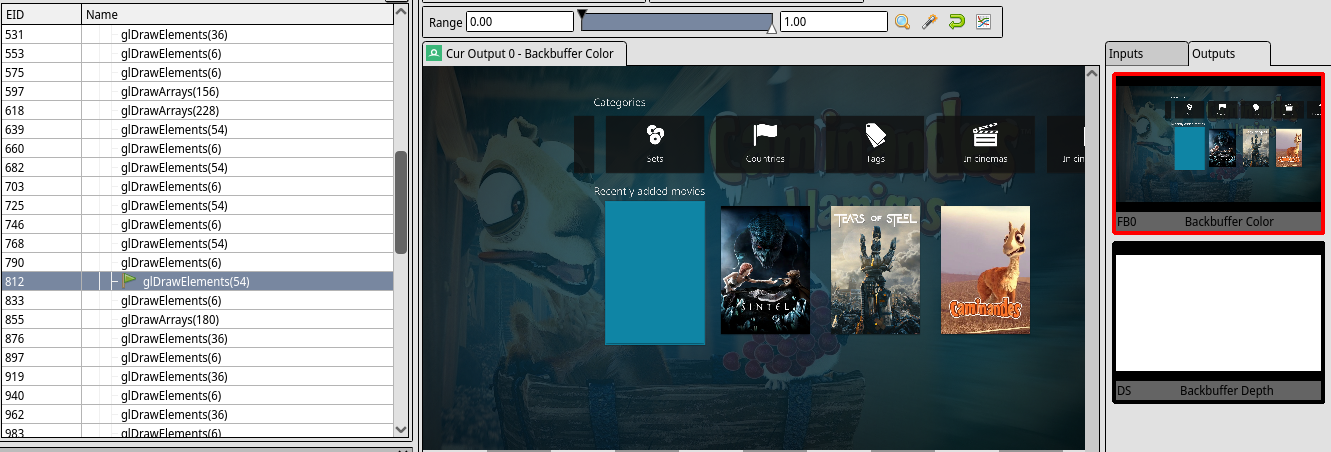
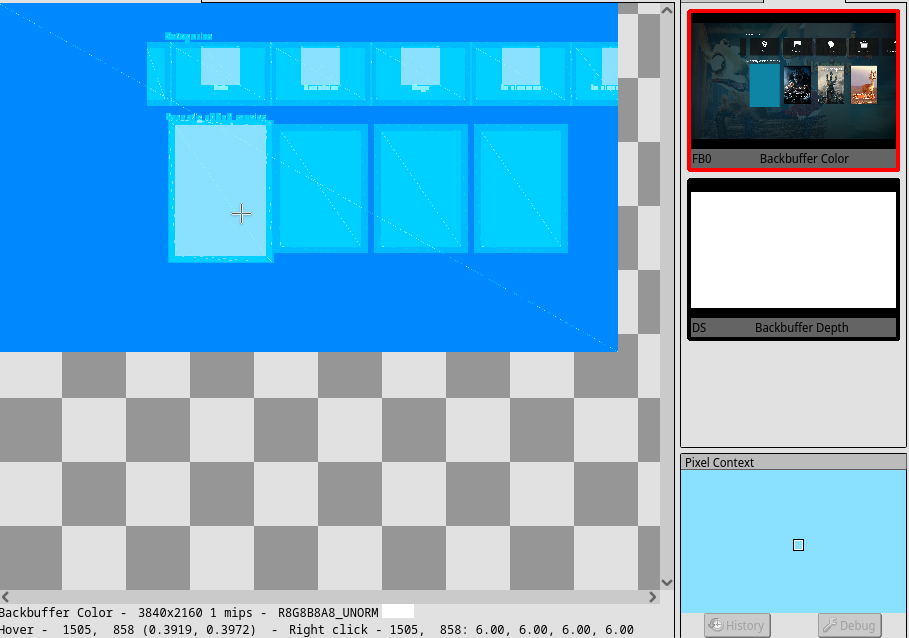
Select the "Texture Viewer" tab. In the "Event Browser" on the left hand side, extend the "Colour Pass" list on the left. There you can 'replay' each draw command the GPU receives for this frame. On the main screen, you will see the state of the framebuffer at the selected GPU command.
On the right, you can switch to the input texture of the selected draw command. With a click on the thumbnail, it will show up on the main screen. The alpha channel is off by default, so some textures might look a bit odd.
By right clicking on the main screen, the content of the selected pixel can be analyzed.
Overlays
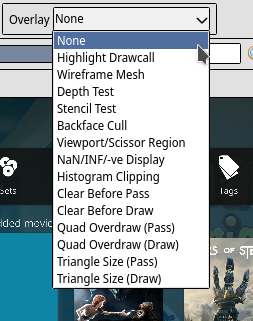
Some overlays have relevance for Kodi. Select one with the dropdown menu.
Highlight Drawcall
Shows the boundary box of the selected draw call.
Wireframe mesh
Shows the geometry the current selected draw call is using.
Quad Overdraw (Pass)
Shows the accumulated amount of overdraw of the currently selected draw call. This is the most interesting overlay. It shows how many layers are making up the skin. The colors change with each layer applied. Right click on a pixel to see how many layers are drawn.
Higher numbers should be investigated. See the Skin Optimization page for more info.
Performance estimation
First of, any performance numbers gathered here are only indicative and might not reflect real world results. Numbers scale with current clock speed of the GPU. Memory bottlenecks are usually not encountered in this static test. Any results are only remotely comparative with other ones taken on the same system.
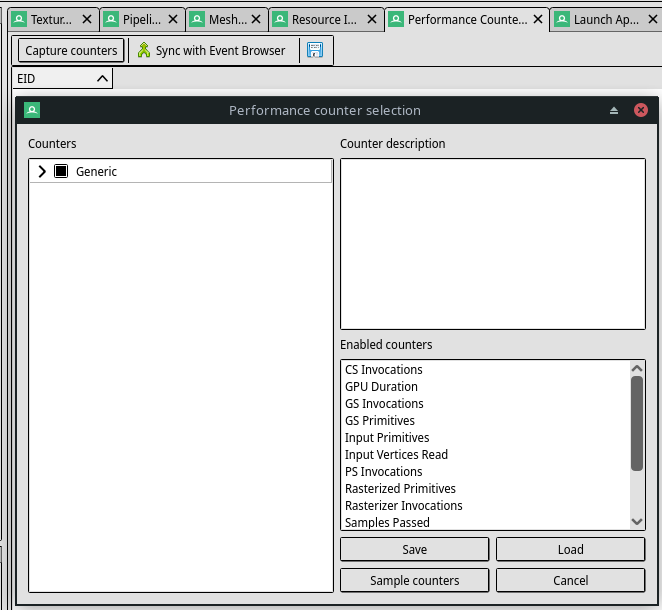
Navigate to "Performance Counters". If the tab is not shown, enable it via "Window". Click "Capture counters", select generic (or other metrics if available) and hit "Sample counters".
On the result screen, "GPU Duration (µs)" and "PS Invocations" are the most interesting fields. The first one indicates how long the draw call has taken, the latter describes how many pixels where put out during the call. Double clicking a call will select it in the Event Browser. From here, you can hop into the Texture Viewer to see what's taking so long.
